To begin with there are four areas of the spine; cervical, thoracic, lumbar, and the sacrum. The cervical consists of seven vertebrae, in the neck region, that is quite flexible. The thoracic consists of twelve vertebrae with twelve ribs, in the chest or mid-back region, that are quite rigid. The lumbar is made up of five vertebrae, in the lower back region, that are more flexible than the thoracic but not as flexible as the cervical. The sacrum and coccyx is one solid bone that is sometimes referred to as the tail bone.
The vertebrae of vertebral bodies are the bone structures in the entire spine. The vertebrae are the smallest in the cervical and increase in size down the spine with the largest being in the lumbar. The vertebrae provide most of the weight-bearing and stability in the spine. The ligaments, disc, and muscles all attach to the vertebral bodies and aid in stability and movement.

The facet joints are the actual joint in the spine that controls the amount and direction of movement in all spinal regions. These joints allow more movement in the cervical and lumbar regions while limiting movement in the thoracic. Facet joints work just like any other joint in your body and have the same properties as any other joint. This means that they all have fluid to lubricate the joint and cartilage to provide smooth motion. Arthritis can also occur in these joints.
The ligaments are strong, non-elastic structures that hold the bones of the spine together. Ligaments also have the job of limiting motion so that facet joints are not injured during a movement. There are numerous ligaments located in the spine and they go in all different directions and attach to different parts of the vertebral bodies. These ligaments are just like all other ligaments in that they can be pulled, stretched and torn.
There are also numerous muscles that attach to the spine and help control the direction and speed of the movement of the spine. Some muscles even have a job in helping with keeping the spine stable and maintaining good posture. Besides the muscle that moves the spine, there are other muscles that attach to the spine that help with the movement of the arms and legs. Any of these muscles can be pulled or injured, just like a hamstring or quadriceps muscles.
The discs are the shock-absorbing structures of the spine. The discs have a center that is jelly-like and is surrounded by tough rubber-like bands that attach to the bones. The jelly-like substance is the main shock absorber for the spine, while the rubber-like bands help control flexibility and distribute the forces evenly throughout the spine. The disc can be injured in many different ways. Some types of injuries could include a herniation, a tear, or a bulge.
The nerves are the communication system for the entire body. The nerves pass through openings between the vertebrae. Nerves from the neck go to the arms and nerves from the lower back go to the legs. The nerves carry information to the arms or legs, or information comes from the arms or legs and is sent to the brain. The nerves are usually injured by one of the other structures listed above.
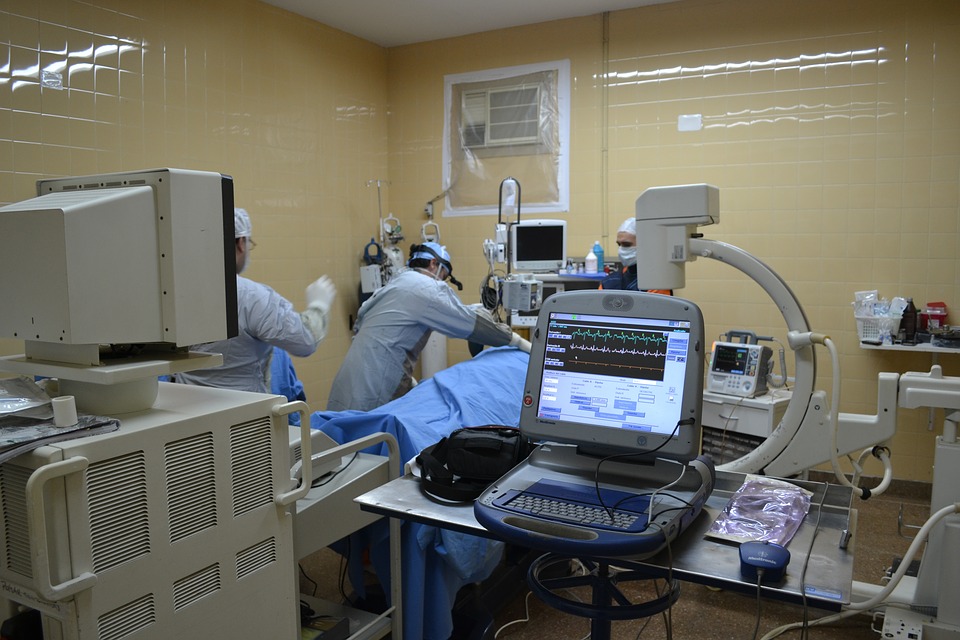
All of these structures can cause pain in the back, neck, arms, or legs. By knowing the general anatomy of the spine, a better understanding of how the spine works will help to limit pain and injuries to the spine. If you are Having to have spine surgery then it is recommended that you get in touch with a professional regarding your problem. Moreover, if you are having a specific problem, you should see a medical professional for an accurate diagnosis and treatment that will allow you to cure your problem right of the start.